
Forecast vs actual
The cost at quotation and the real cost at job close are placed side by side, order by order.

ADVANCED CAPABILITIES · 07 — ACTUAL & FORECAST COST
The cost you calculate when quoting and the cost that materializes when the job closes are rarely the same. WinPremium compares each order's forecast and actual cost line by line, and shows — before the job ends — how a seemingly profitable order really closes once overheads are included.
 Live cost on the shop-floor board
The cost at quotation and the real cost at job close are placed side by side, order by order.
Material, labor, dies, varnish, freight and overheads show separately; where the gap formed is plain.
Once overheads are included, the margin the job really closes at emerges before it ends.
LAST WEEK · JOBS CLOSED
forecast vs actual
LOOKED PROFITABLE, CLOSED AT A LOSS
real cost gap
LARGEST VARIANCE
over forecast
CLOSED UNDER BUDGET
a pricing opportunity appears
Click a job — the line-by-line cost comparison and true profit analysis opens.
WHY DOES IT MATTER?
Most manufacturers quote on instinct or a rough calculation. When the job closes, the real cost is usually different — overtime, high waste, unexpected freight or unallocated overheads. A company that cannot see that gap loses money on jobs it believes are profitable, and finds out at month end rather than end of shift.
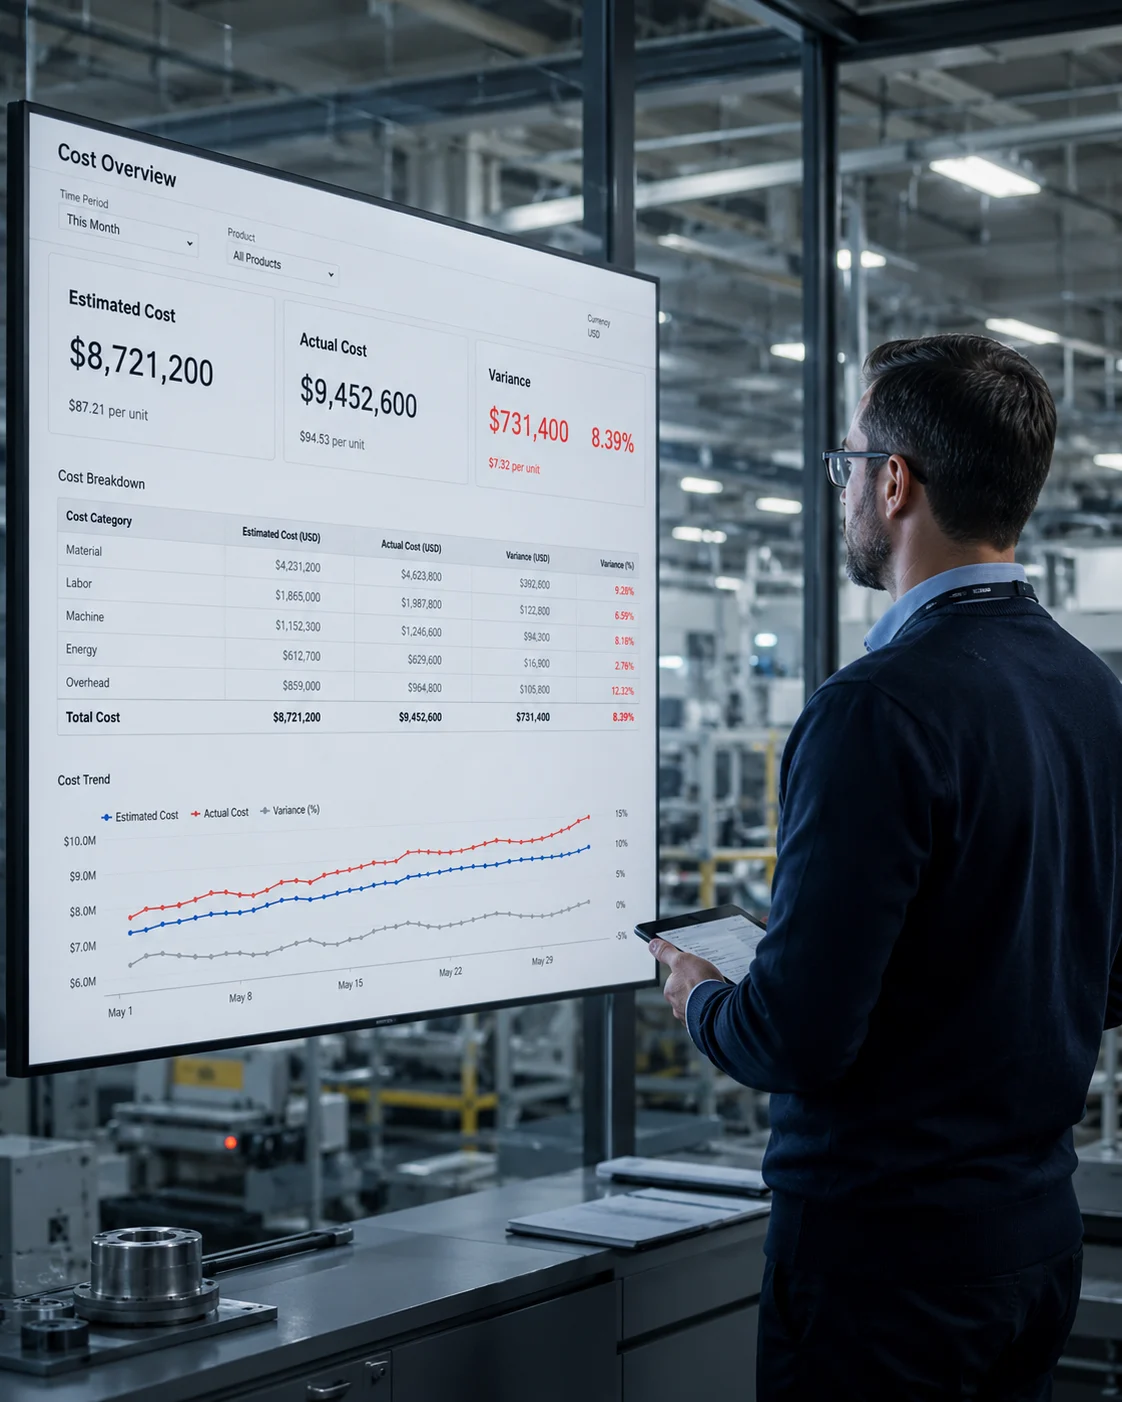 Cost & variance analysis — WinPremium
A company that knows its real cost prices the next quotation on data, not instinct.
Invisible items such as waste, overtime, rework and freight are traced down to the order.
Jobs that look profitable but will lose money are flagged at the quotation stage.
Overheads are allocated to each order in proportion; no job hides another's cost.
A CONCRETE EXAMPLE
On the IKONE order, the quotation looked 131% profitable against material and labor. Once overheads, the general machine and labor share and freight were added, the real margin fell to 57.2%. That gap is not small: the decision to price the same job correctly next time — or to decline it — rests on that number.
IKONE 20×20×5 · #0b5cff
That gap of 73.8 points comes from unallocated overheads. WinPremium distributes that share across every order and shows true profit before the job ends.
ADVANCED CAPABILITIES · 07 — ACTUAL & FORECAST COST
The cost you calculate when quoting and the cost that materializes when the job closes are rarely the same. WinPremium compares each order's forecast and actual cost line by line, and shows — before the job ends — how a seemingly profitable order really closes once overheads are included.
Live cost on the shop-floor board
{{ i.desc }}
{{ k.top }}
{{ k.sub }}
Click a job — the line-by-line cost comparison and true profit analysis opens.
Margin Summary
* Illustrated with data from a real customer engagement.
WHY DOES IT MATTER?
Most manufacturers quote on instinct or a rough calculation. When the job closes, the real cost is usually different — overtime, high waste, unexpected freight or unallocated overheads. A company that cannot see that gap loses money on jobs it believes are profitable, and finds out at month end rather than end of shift.
Cost & variance analysis — WinPremium
{{ b.desc }}
A CONCRETE EXAMPLE
On the IKONE order, the quotation looked 131% profitable against material and labor. Once overheads, the general machine and labor share and freight were added, the real margin fell to 57.2%. That gap is not small: the decision to price the same job correctly next time — or to decline it — rests on that number.
IKONE 20×20×5 · #0b5cff
That gap of 73.8 points comes from unallocated overheads. WinPremium distributes that share across every order and shows true profit before the job ends.