
BSS Technology PLATFORM/PRODUCTION AUTOMATION (MAS)
ADVANCED CAPABILITIES · 08 — PRODUCTION AUTOMATION (MAS)

Get full output from every machine.

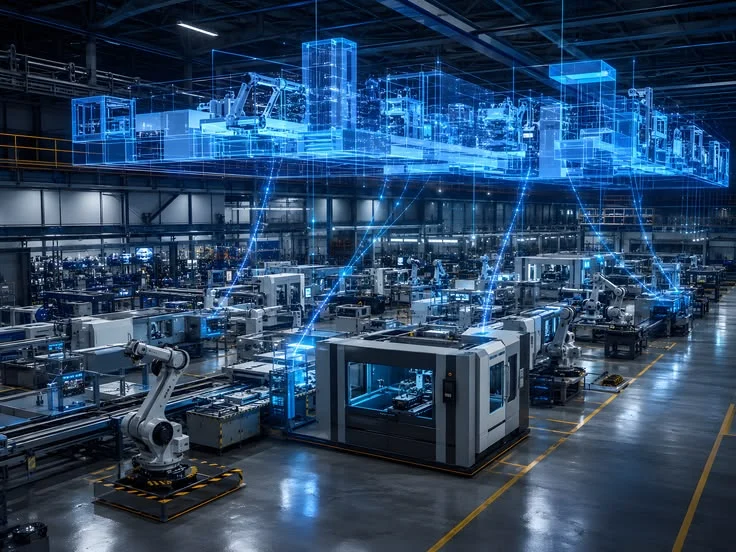
BSS Technology automation engineers inspect every machine in your plant on site and make it talk to our software. Data is read automatically from machine counters, PLCs, encoders or Intelligent IO cards and recorded in the ERP.

WHY AUTOMATION?

An unconnected machine is an invisible loss.

Manually recorded output arrives late, incomplete and inaccurate. Data read at the machine is immediate, complete and beyond dispute — planning, cost and quality run on it.

Full

Full yield from machine and software — connected production makes idle capacity visible.

24/7

Uninterrupted monitoring — output, downtime and consumption are recorded around the clock.

< 1 sec

No lag between floor and screen — data reaches the dashboard the moment it forms.

Vendor independent

Counters, PLCs and terminals connect to the system regardless of brand or age.

FROM THE FLOOR TO THE SYSTEM

Our automation engineers make every machine talk to the software.

Brand, age or communication protocol makes no difference. Our team inspects the machine on site, picks the right interface and carries the data into ERP, MES and the executive dashboards.

01

On-site review

Our automation engineers come to the floor and map each machine's output, signals and communication structure.

02

The right interface

Counter, PLC or terminal — the right connection is chosen for the machine; extra sensors are fitted where needed.

03

Carrying it into the system

Data connects to ERP, MES and the cost module; every signal is matched to its work order and machine.

04

Live dashboard

Output, downtime, speed and waste stream live to the executive dashboard; decisions are made in step with the floor.

ONCE CONNECTED

Every machine becomes a live row on the dashboard.

WWinPremium · My Machines 14:38:23 Live

Running Lines

5/6

Whole shift active

Active Downtime

1

Bobst Mastercut · die-cutting

Average Scrap

2.1%

▼ since start of shift

Starts Today

12

last restart 13:47

MACHINESPEEDWASTEOEELAST 60 MIN · STOPS AND STARTSLAST EVENT
BHS QF 2.8 · CorrugatedA. Yılmaz · Work order #4812 285m/min 1.7% 91% Running 13:47
KBA Rapida 162 · OffsetM. Demir · Work order #4809 8,463sheets/h 1.3% 88% Running 11:03
Billhöfer MTC 106 · LaminationS. Kaya · Work order #4815 6,082sheets/h 2.0% 84% Running 09:26
Laminator L6 165×100 · Board laminationE. Çetin · Work order #4820 5,421sheets/h 2.2% 82% Running 10:14
Bobst Mastercut 145 · Die-cutDie change · Work order #4821 0sheets/h — 0% Down 18:23
Omega Allpro 165 · GluingH. Acar · Work order #4818 5,180units/h 3.1% 79% Running 07:58
Running Short stop Downtime Each cell ≈ 2.5 min · data live from automation

WHAT WE READ FROM THE FLOOR

Every signal from the machine turns into a decision.

Output counter

Actual count and speed come straight from the machine; the gap to plan shows instantly.

Downtime and its reason

The moment a machine stops, duration and reason are recorded — no waiting for the end of shift.

Waste and consumption

Actual consumption and waste are written to the work order; cost is calculated from floor data.

OEE and capacity

Availability, performance and quality combine into a single OEE figure.

Machine status

Temperature, cycle and sensor data; pre-failure signals are caught early.

Events and alarms

Threshold breaches and critical events become instant alerts on the dashboard.

PLATFORM CAPABILITIES THAT COMPLETE AUTOMATION

A connected machine becomes live data in every layer of the platform.

NEXT · 09 — GXP VALIDATION

Every triggered action leaves a verifiable trail.

Continue

← 07 Cost · Home